
How to diagnose common machine learning problems using learning curves
July 14, 2022

This blog is by Valluri Saikiran, Senior Speech Recognition Engineer
Introduction
Machine learning (ML) is core to our speech recognition technology at SoapBox Labs.
Training, deploying, and evaluating an ML model is not a fully automated process and requires a lot of human supervision, as ML is privy to issues such as overfitting, underfitting, bias, and poor generalization. These problems can arise during training, testing time, or both.
At SoapBox, we require our models to achieve very high accuracy levels on challenging test sets for deployment. Anything short of meeting our rigorous standards is a matter of concern and we need to go back and evaluate the areas of the model to improve upon.
One way to do this is by analyzing learning curves.
Learning curve analysis provides a way to visualize problems with ML models and identify them early on.
In this blog, we will review what a learning curve is and how the structure or shape of a learning curve can help us diagnose common issues with ML model performance, as well as training and validation datasets.
What is a learning curve?
A learning curve is a plot representing the evolution of a model’s accuracy as training progresses over multiple epochs or iterations. It also represents the measure of how much experience the model gains during the process of learning or optimizing itself on the training data.
Exactly speaking, a learning curve plots the average loss function value against the number of training epochs.
A loss function metric is the value that represents the error (or inaccuracy) estimate of the machine learning model for the target application. So the lower the loss, the better the model’s performance. Thus, ML model training involves minimizing the loss metric on the entire training dataset.
An ML model’s loss value is periodically monitored and validated on a validation dataset to keep track on how well the ML model is learning to generalize on unseen or unknown held out data during training.
Training loss is the average loss function value per data sample computed on the training data. Likewise, validation loss is the average loss function value per data sample computed on the validation data.
Diagnosing machine learning model performance
By analyzing the shape of a learning curve, we can diagnose common machine learning problems and infer changes needed to improve the model.
There are three common ML model scenarios:
- Goodfit,
- Underfit (or high bias), and
- Overfit (or high variance).
Goodfit model
This graph represents a goodfit model scenario, meaning the model is fit for deployment.
The training and validation loss functions reach a minimal point of convergence after training for many epochs and there is a negligible gap between the two final values, with the training data loss being slightly lower than the validation data loss.
A goodfit speech recognition machine learning model would have a low word error rate (WER) on input speech from across various accents, dialects, or other speaker demographics.
Underfit model
An underfit model is a machine learning model that was unable to learn the training dataset.
There are two types of underfit models:
Case 1
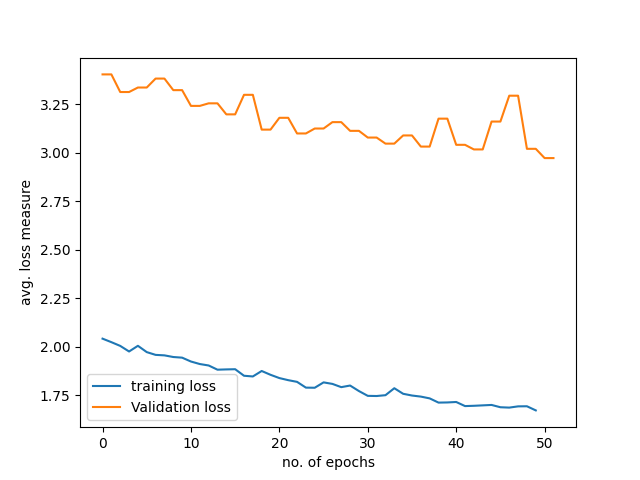
The first underfit model is represented by a loss curve that shows a flat line or noisy values of relatively high loss, indicating that the model was unable to learn the training dataset.
This case is evident with the training loss remaining flat after a slight decrease in value in the beginning epochs.
Generally while training speech recognition models, we combat this problem by selecting model architectures of increased complexity and high variance, increasing the number of model parameters, or increasing the input features dimension.
Case 2
The second type of underfit model is represented by a graph where training loss continues to decrease even at the end of training epochs.
In this case, further training for more epochs may be needed.
Overfit model
An overfit model is an ML model that is too closely aligned to the training data. This means that it performs well for training data but not for the validation data. As such, it makes inaccurate predictions about new data since it’s unable to generalize.
There are two types of overfit models:
Case 1
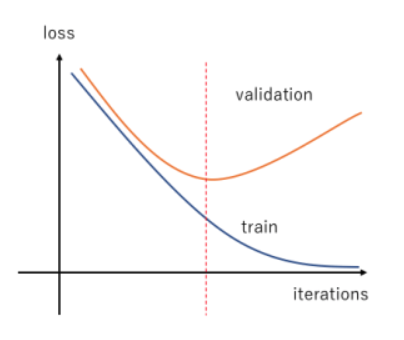
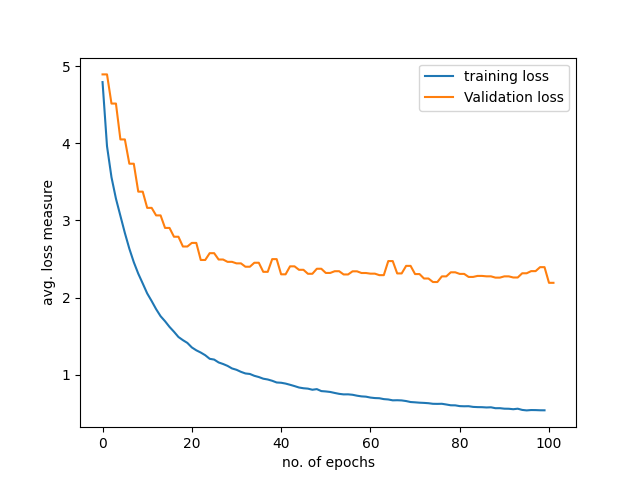
In the first type of overfit model, the training loss function continues to reduce with the number of epochs; whereas the validation loss function continues to decrease till a minimum value and then begins increasing.
In such scenarios in speech recognition models, we often use an early stopping criterion based on the validation data loss value.
Case 2
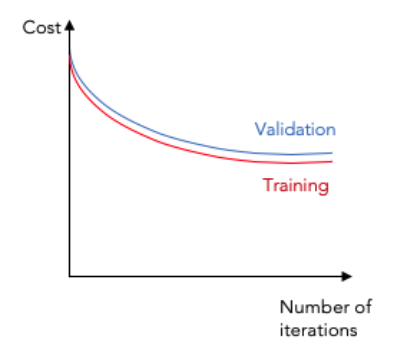
In the second type of overfit model, both the training and validation loss converge to a point of stability, but there is still a significantly large gap between their final values of convergence.
In speech recognition, this often means the model has perfectly learned the intrinsic characteristics or nuances of the training data but fails to generalize the unknown speakers’ data containing unseen accents or dialects.
In such scenarios, we generally experiment by implementing standard data augmentation strategies like adding noise, spectral augmentation, and speed and volume and pitch perturbations on the training data to help the model make more accurate predictions. It also helps to analyze the per-phoneme, age, accent, or gender statistics of the training data and add in more training data especially for the output target classes with less data counts.
Overfitting could also be mitigated by using ML regularization methods such as Lasso and Ridge or by applying dropout strategies on the model parameters during training. Multi-task learning also might help to prevent overfitting in end-to-end speech recognition models like the joint CTC-Attention based speech recognition. Using simpler model architectures with less variance and parameters might also help in combating overfitting problems.
Diagnosing unrepresentative datasets
In addition to helping diagnose common machine learning problems, learning curves can also help diagnose issues with training and validation datasets.
Unrepresentative training dataset
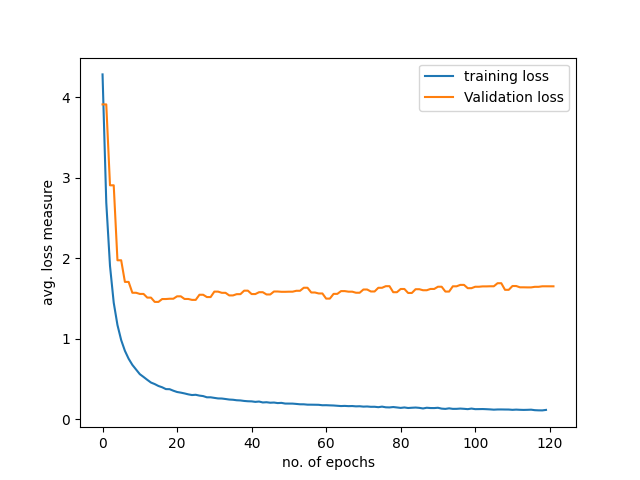
An unrepresentative training data set is similar to the overfitting problem, with both the training and validation losses converging to their minimal loss values and a large gap existing between the two values after the training finishes.
This generally means that the training data doesn’t have enough information required to train the model for robust speech recognition on real-world speech utterances.
In such situations, we commission the ASR data collection for different accents or dialects which are least represented in the training data. In certain cases, data augmentation strategies might also help on the training dataset.
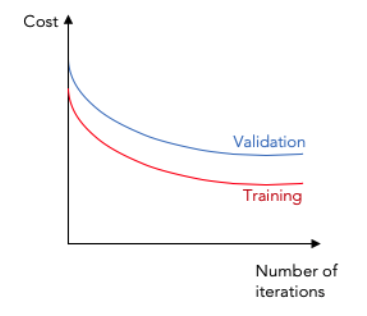
Unrepresentative validation dataset
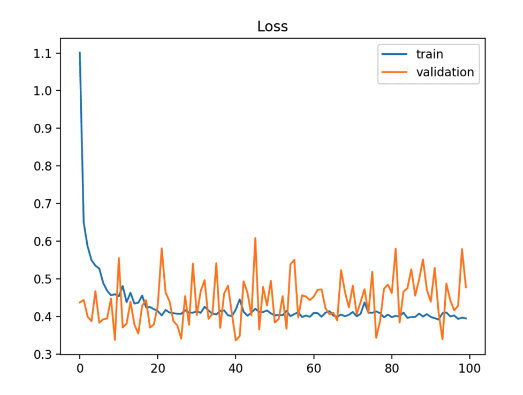
With an unrepresentative validation dataset, we observe the training loss being higher than the validation loss. The validation loss in certain cases shows noisy movements around the training loss.
In speech recognition use cases, this implies that the model finds the validation speech data to be much easier to decode to text than the training data.
This might sound counterintuitive since the model is trained to minimize the loss function on the training dataset and is supposed to perform better on the training dataset. But what if the validation data was indeed containing easier examples for speech recognition?
For example, the validation dataset might contain clean speech audio samples, which the speech recognition model could decode more accurately. In such a situation, we add more difficult, real-world noisy data samples to the validation dataset.
Conclusion
Here’s a recap of what we covered:
- A learning curve is a plot representing the evolution of a model’s accuracy as training progresses over multiple epochs or iterations.
- By analyzing the shape of a learning curve, we can diagnose common machine learning problems and infer the changes needed to improve the model.
- There are three common types of learning curves: goodfit, underfit, and overfit.
- We can also use learning curves to diagnose issues with our training and validation datasets.
Want to learn more about SoapBox Labs?
Visit The SoapBox Tech Blog for the latest articles and stories from our Speech Tech, Engineering, and Product teams on how our voice engine works and tips and tricks for designing voice experiences for kids.
If you enjoyed this blog, you may also want to check out:
- An introduction to MLOps: Benefits, principles, and applications
- NLG in conversational AI: The challenges of generating language
Also, explore our website for use case videos, more about our technology and company, and many additional resources.
Share this
Related